- 2.1 Introduction
- 2.2 Nutritional Status – A Brief Concept
- 2.3 Importance of Assessing Nutritional Status
- 2.4 Anthropometric Methods
- 2.5 Biochemical Methods
- 2.6 Clinical Assessment (Signs and Symptoms)
- 2.7 Dietary History
2.1 INTRODUCTION
A healthy diet is required for maintaining normal growth and development. Such a diet includes sufficient amounts of carbohydrate, protein, fat and vitamin. Balanced diet is the key to normal growth and development. An imbalance in the dietary habit leads to an imbalance of nutrients in the body: This results into susceptibility to recurring infections and diseases, slow or retarded growth and eventually early death.
This Unit focuses on different methods that one can employ to assess nutritional status. These methods are very simple, yet objective and the results are easy to interpret and reproduce, These have been successfully utilized in various field situations. However, each method has its own advantages and disadvantages and the method chosen depends on the situation.
2.2 NUTRITIONAL STATUS – A BRIEF CONCEPT
Nutrition is an important component of preventive health care.An optimum level of nutrition is .the amount of intake that promotes to the highest level of health. Individual nutritional levels are closely related to the status of health and disease. However, an excess calorie intake leads to obesity, whereas a deficit intake of calorie results into a depletion of essential nutrients. These alterations can lead to biochemical changes and eventually to clinical signs and symptoms. Nutritional. requirements are influenced by many factors such as gender, age, physical activity, physiological status” drugs and alcohol intake. Nutritional status is now recognized as one of the prime indicators of the health of an individual.
Causes of Malnutrition
Direct Causes of malnutrition are mainly (a) low food intake and (b) frequent attack of diseases and infections. The list of indirect causes is a long one and is as follows:
- Decrease in the availability of food resources due to population explosion
- Low production
- Low purchasing power
- Poor personal hygiene and sanitation
- High susceptibility to diseases and infections
- Lack of awareness
Of the 800 million individuals undernourished worldwide, a little under one-third (258 million individuals) are concentrated in South Asia (Gaiha, 1997). Undernutrition is the principal cause of ill-health, premature mortality and morbidity among children of the developing countries (Uthman and Aremu, 2008). About 70% of the world’s, malnourished children live in Asia, giving that region the highest concentration of worldwide childhood malnutrition (Khor, 2005).
With its large population size and widespread poverty, a majority of individuals in India are undernourished (Antony and Laxmaiah, 2008). Tndia shows the world’s highest prevalence of childhood under-nutrition with more than half of its children being undernourished (Bamji, 2003). In India, the prevalence of obesity is increasing in the urban ‘areas than in the rural areas. This is the results of new dietary habits and sedentary lifestyles.
We all know that
- Lack/excess of intake and/or faulty utilization of nutrients in the body can lead. to malnutrition.
- Malnutrition is of two types: under-nutrition and over-nutrition .
- The ultimate objective of nutritional assessment studies is to improve human health and hence the quality of life of human beings.
2.3 IMPORTANCE OF ASSESSING NUTRITIONAL STATUS
Assessing nutritional status is very important for screening and identifying individuals and populations that are affected by/at risk with malnutrition. This, in turn, is very useful in the development and formulation of nutritional intervention and awareness programmes. Such assessments also help to analyze the impact of these programmes on the individuals and the community.
The World Health Organization (WHO) believes that the ultimate objective of nutritional assessments is the improvement in the quality of human health (Beghin et al., 1988).
Nutritional assessment may be defined as a judgement of the quality and quantity of the intake and the subsequent utilization of nutrients. The methods adopted .for nutritional assessment can be classified into two groups: Direct Methods and Indirect Methods (WHO, 1966).
Direct Methods are directly related with the individual and the parameters taken are considered to be objective, whereas indirect methods are the methods which rely on various demographic indices that are related to the community. Each method is unique in its advantages and limitations. Ideally, the results of all the methods should be taken together to assess nutritional status and formulate suitable intervention programmes to improve the level of nutrition and health.
What are the direct methods?
- Anthropometric measurements
- Biochemical assessments
- Clinical examinations
- Dietary assessments
It can be remembered as “ABCD”.
- A for Anthropometric measurements
- B for Biochemical assessments
- C for Clinical examinations
- D for Dietary assessments
What are the indirect methods?
These are the vital statistics data that are obtained from’ the census and demographic data. They also include data from other important sources such as per capita income and population density.
The World Health Organization (WHO) has played a significant role in formulating and standardizing the methods used to assess nutritional status of individuals and populations. Very important recommendations were given by the WHO Expert Committee on Medical Assessment of Nutritional Status in 1963. These recommendations led to the publication of the World Health Organization Monograph Series No. 53 entitled “The Assessment of the Nutritional Status of the Community” in the year 1966 authored by D.B. Jelliffe.
| WHO expert committee recommendation (1963): “There is an urgent need for a standard guide which would give detailed instructions about planning and conducting nutrition surveys, and the reporting of results, and which would contain information of assistance to the correct interpretation of results. The Committee strongly recommends that WHO undertake the preparation of a manual to meet this need.” |
2.4 ANTHROPOMETRIC METHODS
Anthropometry has been widely and successfully applied to the assessment of health and nutritional risk. It is a useful technique ‘to assess nutritional status andbody composition of an individual or population (WHO, 1966; Hamieda and Billot, 2002). Anthropometry is the single most universally applicable, inexpensive, and non-invasive technique available to assess the size, proportions and composition of the human body.
The most commonly utilized measurement are as follows:
- a) Height/length
- b) Weight
- c) Mid-upper arm circumference (MUAC)
- d) Head circumference
- e) Chest circumference
- f) Waist circumference
Height
Height is very important for assessing nutritional status-as a normal individual attains a particular height at a particular age and has to be measured in a standardized manner.
Weight
An individual has to obtain a standard weight for age to attain normal nutritional status. Weight increases with the increase in the age of a healthy child.
There are standard range of weight of a child given age/height and standard range of height given age. If a child falls short of the minimum values of these ranges the child is underweight. On the other hand, if the child lies above the maximum values of the ranges then he/she is overweight.
Mid-upper arm circumference (MUAC)
MUAC can be used for screening under-weight. It can be utilized along with BMI to identify the preferential loss of peripheral tissue stores of fat and protein. It is very useful to assess the nutritional status of children aged less than 5 years as it does not change much during the age of 1 year till 5 years. It is also of great value e pecially when a large number of children are to be covered and there is confusion regarding their ages. MUAC coloured tape are being regularly used during emergencies such as famines.
MUAC values below 23.0 cm and below 22.0 cm are considered to be undernourished for adult males and females respectively (James et al., 1994). For children the cut off point is 12.5 cm for both boys and girls. A series of MUAC cut-off points have also now been identified to allow the screening of individual adults under extreme conditions, e.g. during famines (Ferro-Luzzi and lames, 1996).
Head circumference
Brain size and head circumference can be affected by under-nutrition, especially in case of protein energy malnutrition. The greatest circumference is to be measured for head circumference.
Chest circumference
Chest circumference is a useful indicator of growth in the 2nd and 3rd years of life. A chest/heap circumference ratio of < 1 recorded in children aged 6 months to 5 years indicates under-nutrition. If the chest circumference is more than the head circumference among children aged 1 year to 5 year , it is an indication of protein energy malnutrition.
Waist circumference
Waist measurement can be used to assess obesity, and two levels of risk have been identified. These are:
Risk Level I: Males> 94.0 cm Females> 80.0 cm
Risk Level II: Males> 102.0 cm Females> 88.0 cm
Level I is utilized for the maximum acceptable waist circumference, while Level II is significant for the screening of obesity and requires weight reduction management therapy.
Commonly Used Indices to Determine Nutritional Status
The commonly used indices in this regard are the Body Mass Index (BM!), Height-for-age, Weight-for-age, Weight-for-height, Waist-hip ratio and Waistheight ratio, These indices are expressed in terms of Z-scores or percentiles. The WHO recommends a comparison of these indices with an international reference population to determine under-nutrition (Dibley et aI., 1987). The justification for use of a reference population, is the empirical finding that well-nourished children in all communities follow very similar growth patterns (Habicht et al., 1974). If the measurements and indices are compatible with those of the reference standards, then the individual is considered to be nutritionally healthy. If lower than the values, then the individual suffers from under-nutrition. In case the observed values are higher than those of the reference, then it is a case of over-nutrition.
International reference standards are provided by the National Centre for Health Statistics (NCHS), USA. Indian reference standards have been complied by the National Institute of Nutrition (NIN), Hyderabad.
The reliability of the anthropometric data depends on two important factors: accurate age estimation and the normal reference values for comparison of the measurements obtained.
Body Mass Index
BMI = body weight / height2
the units being kg/mt’ for BMI, kg (kilogram) for weight and m (meter) for height. BM} is a good indicator of under-nutrition in terms of Chronic Energy Deficiency (CED) in populations (Ferro-Luzzi and James, 1996) and isnon-invasive, inexpensive and can be used for large-scale surveys well suited for the assessment of malnutrition because it is.
| BM! cut-off values for assessing malnutrition, according to WHO (1995) CED Grade III BMI < 16.00 kg/m2 CED Grade II BM! 16.00 kg/m2- 16.99 kg/m2 CED Grade I BMI 17.00 kg/m? – 18.49 kg/m2 Normal BM! 18.50 kg/m2- 24.99 kg/m2 Overweight BMI 25.00 kg/m-» 29.99 kg/m2 Obese BM! 2: 30.00 kg/m2 |
Height-for-age
Individual height reflects the total increase in size of the person and indicates adequate nutritional status. The height-for-age index is a long term measure of the duration of malnutrition. Low height for age is also known as stunting, stunting usually occurs before age two.
Weight-for-age
Changes in weight are more pronounced than height, as weight is more sensitive to changes in individual growth patterns. The weight-for-age index is a commonly used indicator of body size and it reflects food intake levels. This index is a good indicator of’ short-term and acute under-nutrition.
Weight-for-height
Sometimes it is difficult to ascertain the correct date of birth and subsequently the age of the individual. Then the relation between weight and height instead of weightfor-age can be used. This index provides an indication of thinness of the individual and shows chronic and acute under-nutrition. Wastingrefers to low weight-for-height.
Waist-hip ratio (WHR)
Waist-hip ratio = Waist circumference in cm / Hip circumference in cm.
WHR values> 0.90 in males and> 0.80 in females are considered to be high risk for diseases such as diabetes.
Waist-height ratio
Waist-height ratio = Waist circumference in cm / height in cm.
A cut-off value of 0.5 is suggested for both sexes to a sess obesity (Hsieh et al., 2004).
Some New Indices and Cut-Offs
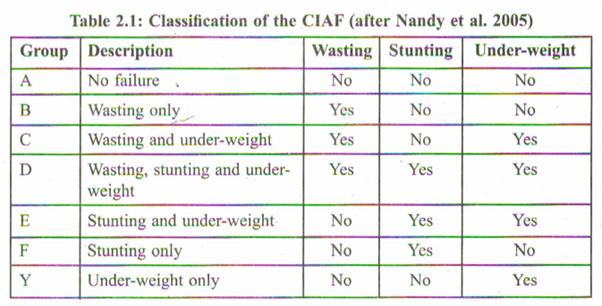
The Composite Index of Anthropometric failure (CIAF)
The conventional indices of stunting, under-weight and wasting only allow for the categorization of children into the general categories of under-nutrition and do not provide an opportunity to determine the overall prevalence of under-nutrition that is associated with multiple failures. The number of children suffering from undernutrition was being under-estimated primarily due to overlapping of the children into multiple categories of anthropometric failure. The conventional anthropometric indices are unable to depict the overall prevalence of under-nutrition because a researcher has to ‘choose’ a certain category of anthropometric failure for assessing nutritional status. Hence, while some stunted children may not be affected with wasting and/or underweight, and other similar combinations, others might suffer from all three nutritional failures of stunting, under-weight and wasting. The CIAF is thus, an a:ggregated single anthropometric measure providing an overall estimate of under-nourishment in children. The original model, proposed by Svedberg (2000), comprised of 6 sub-groups of anthropometric failure (Groups A-F) to which Nandy et al. (2005) supplemented one more sub-group (Group y).
New cut-offs for definition of overweight and obesity in children
Cole et al. (2007a) have developed an internationally acceptable definition of child overweight and obesity, specifying the measurement, the reference population and the age and sex specific cut off points.
New cut-offs for BM! for thinness
Cole et al. (2007b) also developed international cut-off points for BM! for thinness grades 1, 2, and 3 by sex for exact ages between 2 and 18 years. These cut-off points correspond to BMI v~~I.I~S16, 17, and 18.5 for adults.”
The main advantages of tJ..,ismethod are that these are objective, precise, nonexpensive and non-irvasive. No sophisticated laboratory is required and there is no collection and transportation of any biological tissue while the main disadvantages .are that inter- and intra- observer errors may occur while recording the measurements and there an; jet to be sorted out issues relating to the reference standards and cut off values.
2.5 BIOCHEMICAL METHODS
The underlying principle of this method is that any changes in the quantity and composition of the diet is reflected by variations in the concentrations of nutrients or their associated compounds in different body tissues and fluids along with the appearance or disappearance ofmetabolites. The method of biochemical assessment estimates the concentrations of essential dietary constituents in the body to evaluate nutritional status.
Haemoglobin estimation is the most important test to interpret the overall state of nutrition. This indicates prevalence of anaemia and deficiencies in proteins and trace elements. Stool examination is utilized to test for the presence of ova andl or intestinal parasites. Urine examination can be used for albumin and sugar tests.
Vitamins and Proteins in Assessing Nutritional Status
Vitamins promote other metabolic reactions in the body’ that produce energy (Omieljaniuk et aI., 1989; Moswa et al. 1985). This in turn leads to better maintenance of cells and tissues, along with promoting growth and development. Hence, a determination of the levels of these vitamins of different body tissues (biornarkers) can help to ascertain deficiencies. The important vitamins needed by the body are vitamins A, B, C, D, E, and K.
Vitamin A deficiency is indicated by plasma B-carotene levels and fasting plasma amino acid pattern, which in turn indicate a deficiency of plasma retino\. Deficiency in vitamin Bl (thiamine) is determined by thiamine levels in urine. The biomarker for riboflavin or vitamin B2 deficiency is urinary riboflavin and the function of the enzyme red cell gluthione reductase is impaired. The biomarker for the determination of vitamin B6 deficiency is urinary 4-pyridoxic acid, indicating plasma pyridoxal 5′ phosphate dysfunction. Deficiency in vitamin B12 is indicated in plasma ‘… holotranscobalamin n levels which in turn show a deficiency in the function of the enzymes plasma vitamin B 12 and plasma methylmalonate. Analysis of plasma and urinary ascorbate levels is associated with a deficiency in vitamin C. There is a cell depletion of leucocyte ascorbate in the long term. Vitamin D deficiency is , documented by the analysis of 25-hydroxy-vitamin D in the plasma. The deficiency results in the improper function of the enzyme plasma alkaline phophatase. The ratio of plasma tocopherol to cholesterol plus triglyceride is the biomarkcr to determine deficiency in vitamin E status. Vitamin K deficiency is determined by the plasma analysis of phylloquinone. Thi deficiency re ults in the impairment in the function of plasma prothromin,
| A biomarker is an objective measure of a biological tissue that helps in the assessment of nutritional status and health and also diagnosis of a disease; |
Proteins are responsible for maintaining fluid balance, blood clotting, cell growth and repair, and immunity. Proteins also provide fuel for the body and glucose for the synthesis of sugar. Diets low in energy and proteins lead to a situation known as protein-energy malnutrition (PEM) and kwashiorkor. Analysis of urinary nitrogen indicates reduced intake of proteins.
Essential Trace Elements in Assessing Nutritional Status
Trace elements are those elements that are present in the human body in minute quantities. Their concentrations are measured in parts per million. Essential trace elements act as catalytic or structural components of larger molecules and they have specific functions which are indispensable for life. These trace elements are required by man in amounts ranging from 50 micrograms to 18 milligrams per day. The main essential trace elements are iron, zinc, selenium, iodine, chromium and copper.
| In June 1990, the Joint FAOIWHO/IAEA Expert Consultation of Trace Elements in Human Nutrition was held in Geneva. A number of trace essential elements along with their functions, interactions and issues relating to their deficiencies and toxicities were discussed in the meeting. |
Iron and transferrin levels in plasma are utilized for determining iron levels and documenting iron deficiency. Plasma zinc is the best biomarker for zinc deficiency. Plasma selenium concentra.tions together with toe nail selenium levels are the established biomarkers of selenium status. Iodine deficiency is analyzed from the concentrations of iodine in urine. Chromium deficiency can be assessed using urine and plasma chromium levels. Serum or plasma copper is the most widely used biomarker for copper deficiency.
Recent epidemiological and clinical evidence has shown that in most developing countries deficiencies of specific micronutrients are somewhat accountable for the morbidity and mortality in malnourished children. Zinc deficiency is a chief cause of morbidity among young children in the developing countries, including India. However, scant information is accessible on the global prevalence of zinc deficiency.
The World Health Organization (WHO), the United Nations Children’s Fund (UNICEF), the International Atomic Energy Agency {IAEA), and the International Zinc Nutrition Consultative Group (IZiNCG) have together reviewed the present methods of assessing population zinc status. They have provided the standard recommendations for the use of specific biochemical, dietary and functional indicators of zinc status in human populations.
The principal advantages of the biochemical method are that it is precise, accurate, reliable and extremely useful in assessing and detecting early cases of malnutrition before the appearance of the clinical signs. The biochemical measurements usually reflect the immediate past intake of nutrients or the changes produced by a longstanding deficient intake of a nutrient. The main disadvantages are that most of the tests are still quite expensive, time consuming and not routinely done. Good laboratory facilities and trained personnel are a pre-requisite. Often in the field situation, it becomes difficult to collect and transport tissue samples which are biologically active.
2.6 CLINICAL ASSESSMENT (SIGNS AND SYMPTOMS)
Clinical examination is a simple, yet objective method to assess nutritional status. The signs and symptoms can be in the skin, mouth, gums, nails, lips, eyes and hair of the subjects under study. Clinical examination may be defined as the method of assessing the nutritional status of an individual by examining the clinical signs and symptoms.
Classification of the physical signs and symptoms
The 1963 WHO Expert Committee on Medical Assessment of Nutritional Status provided a classification of the physical signs that can be utilized for nutritional assessment. This classification was subsequently updated in the World Health Organization Monograph Series No. 53 entitled “The Assessment of the Nutritional Status of the Community” published in the year 1966. The WHO classification is very helpful when a rapid nutritional screening of a population is required within a stipulated time frame and also for specific research studies that needs to evaluate certain signs and symptoms.
Group I: This group constitutes those signs that are of paramount importance in nutritional assessment studies. These signs are sometimes associated with deficiencies in one or more micronutrients and are strongly related to malnutrition. This group is the best suited for individual assessment of nutritional status.
GroupII: This group consists of those signs that are unclear and require more precise investigation. The signs mayor may not be related to malnutrition. The signs under this category are usually noticed among populations in the developing countries.
Group Ill: Signs that arc not related to malnutrition are included in this group. But the problem is that these signs can bear similarities to that of malnutrition. So, it really needs a trained eye to differentiate between the two.
Physical Signs of Malnutrition
Physical signs and symptoms need to be recorded in a precise manner. The signs of malnutrition can be multiple. An experienced observer should possess the inherent capability of going for a more precise assessment of the body, after the initial findings based on a single sign. He/she also has to take into account the physical environment of the subject, along with the cultural features that can contribute to malnutrition. The age of the subject also plays an important role as the signs of a particular deficiency.
The two aspects that are vital for proper and objective diagnosis are the reliability of the signs of symptoms and the experience of the investigator.
For convenience, the signs and symptoms are being classified into two categories. The categories are:
a) Physical signs and general appearance (Table 2.2)
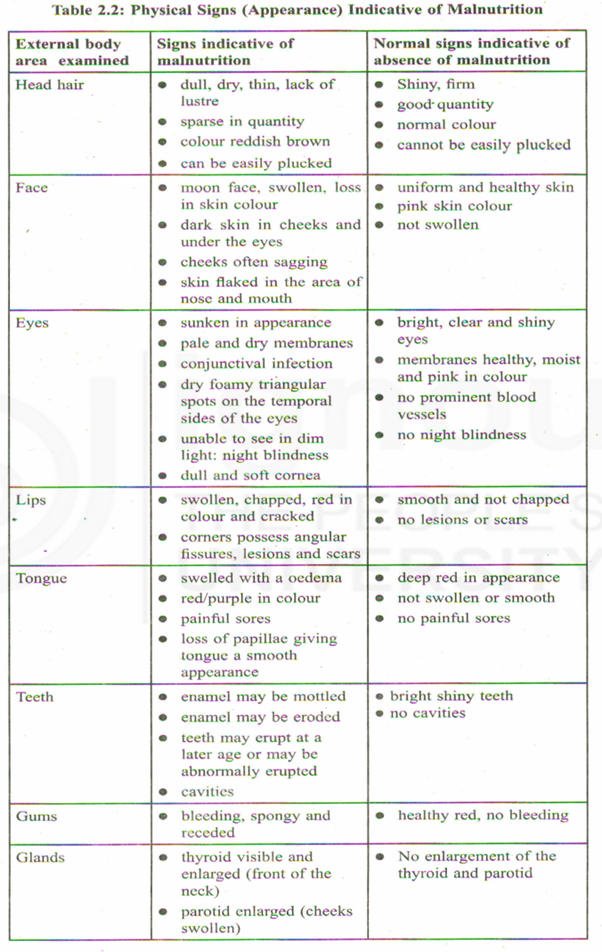
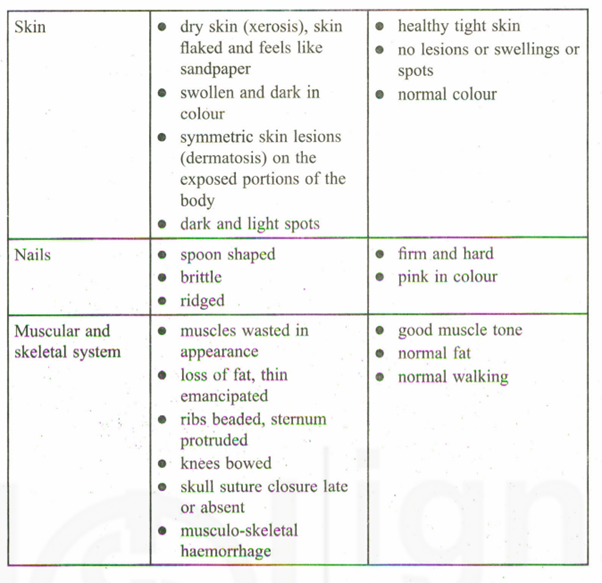
b) Internal signs (Table 2.3)
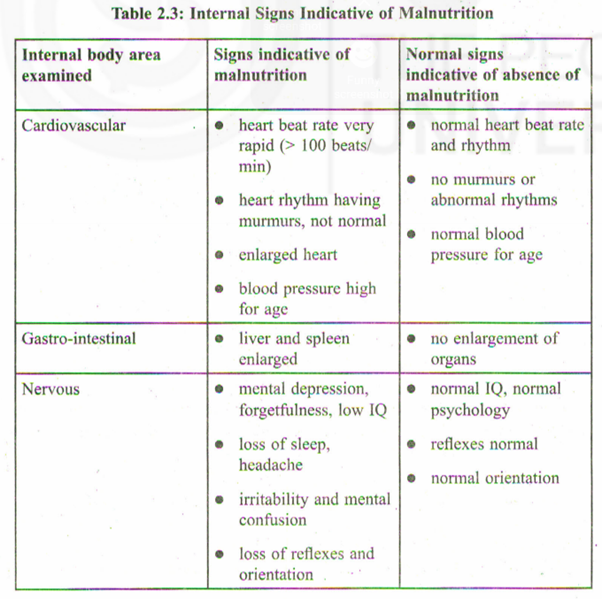
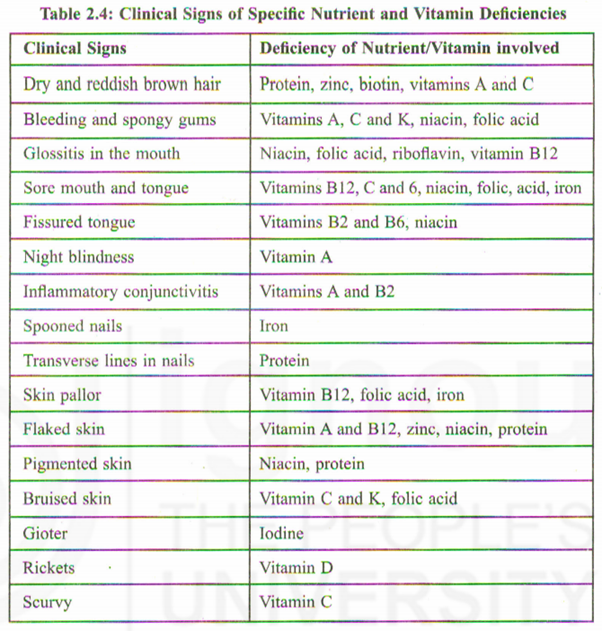
Based on the Tables 2.2 and 2.3, we are now in a position to screen individuals for normal nutrition and malnutrition. Once malnutrition has been established, the next question is whether it can be linked to a specific nutrient or vitamin deficiency. Table 2.4 shows how the clinical signs and symptoms are linked to the deficiency of a particular nutrient and vitamin.
| Indian Government has launched a number of nutritional intervention programmes: Integrated Child Development Services (ICDS), Mid-Day Meal Programme (MDMP), National Iodine Deficiency Disorder Control Programme (NlDDCP), National Nutritional Anaemia Control Programme (NNACP) and the National Control Programme for Prevention of Nutritional Blindness due to Vitamin A Deficiency. |
The physical signs and symptoms need to be recorded as accurately and possible. This can only be attained by the nutritionist/health worker by constant practice. The age of the individual under study is also related to the signs and their interpretation. Any physical finding that is indicative of malnutrition should be a clue that needs to be pursued more precisely. The physical signs and symptoms is strongly related to the ethnic features of the population under study. In a diverse country such as Jndia, this is even more evident.
The main advantages of this method are that it is inexpensive, rapid, reliable and easy to perform in any situation. It is also non-invasive and do not require the collection, transportation and analysis of any biologically active material. No specialized laboratory is required as such. Whereas the main disadvantage of this method is that it is often not possible to detect early cases of malnutrition and that some of the clinical signs may not be specific to a particular nutrient deficiency and often one sign is an indicator of two or more such deficiencies. Moreover, the prevalence of the different clinical signs of malnutrition are quite low. There also can be differences in the assessment of the clinical signs by different observers (interobserver error). The physical signs and symptoms can also vary over time periods.
Physical clinical examination constitutes an inseparable portion in nutritional assessment studies, even though some authorities have opined that it would not be wise to interpret the clinical results alone. Used in a cautious manner in conjunction with the other methods of assessing nutritional status, they can provide a comprehensive assessment of the same.
2.7 DIETARY HISTORY
The dietary data can be collected from individuals and/or families depending on the need and the model/hypothesis. This method has assumed prime importance as nutritionists have now recognized that nutrition has a major role to play so far as the prevalence of obesity, heart diseases and diabetes are concerned. This prevalence is now termed as “aetiology of common chronic diseases”. Dietary surveys are nowadays being increasingly used for both population estimates and individual assessments. Dietary survey may be defined as the systematic study of the dietary intake of individuals and populations/communities. The dietary methods can be both qualitative and quantitative.
Qualitative method typically uses food pyramids to estimate food requirements, servings and consumption and quantitative method calculates the amount of energy and specific nutrients for each food using food consumption tables which are subsequently compared with the RDA.
Dietary surveys are extensively used in the areas of nutritional epidemiology, clinical assessment, population surveillance and experimental research. The dietary surveys have some general advantages. They are inexpensive, relatively easy, objective and yet easy to reproduce. No sophisticated laboratory is required. It is a non-invasive method and there is no requirement of the collection, transportation and analysis of any human tissue. However, the dietary surveys have certain general disadvantages. The assessment of the food amount is usually done by the subjects which may be erroneous. There may be variations in the daily diet that may not be accurately reflected. There also could be under-reporting by the respondents and ofcourse, measurement errors.
Types of dietary surveys
- Twenty-four hour recall
- Weighed intake
- Food frequency questionnaire
- Food diary
- Dietary history
Twenty-four hour recall. Method
All the food items that were consumed during the last 24 hours are recorded in the “24-hour recall method”. This method is utilized in large-scale nutritional surveys. The subject is usually asked to recall and describe in as much detail as possible his/her food intake during the last 24-hours either through an interview or by a questi onnaire.
The most widely preferred subject for this method is the housewife. The investigator asks her to recall the kind and amount of the food used, the preparations actually made and distributed to the family members. Standard measuring containers such as cups, glasses, aucers and spoons are used to help the subject in recalling the information. To get proper information, the investigator may use several stages in which each data obtained are checked and verified.
The main advantages of this method are that it is inexpensive, quick, easy and relies on short-term memory. The 24-hour recall method for a single day is not very suited for correlation with the biochemical or clinical findings. The 24-hour recall method should be repeated for at ‘least 2-3 consecutive days. Some individuals may find it difficult to vividly recall the details about the last day’s diet. The day of the recall may also not be the typical normal day of the individual. Lastly, the individual being interviewed may not be always speaking the truth.
Weighed intake method
In this case the investigator remains actually present when the subject is eating and the food amounts are weighed before serving, during serving and subsequently the left-over (food not consumed). The differences between the amounts of food served and not consumed give the amount of food actually consumed by the individual. The principal advantage of weighed intake method is that it is a very intensive method. The main demerit of the weighed intake method is that it is time consuming. Furthermore, there can be cultural taboos in some societies to eat in front of a stranger or grant the investigator entry to the kitchen,
Food frequency questionnaire (FFQ)
The FFQ method tries to obtain long-term dietary habits. The individuals generally completes the FFQ themselves. The detailed instructions are sent by post along with the questionnaire . However, in the developing countries such as India, it is advisable for the investigator to fill up the questionnaire after interviewing the subjects. In the FFQ method the individual is asked about how often specific food items are consumed. The responses of the subjects are standardized so that the subjects just need to tick mark on the specific responses. The frequency is generally calculated as per week/fortnight/month. The list offood items should not generally exceed 150 items. To standardize, categories ranging from never to six times per day are the usual format. The FFQ method has been used in large epidemiological studies to assess food patterns associated with inadequate intake of nutrients and descriptive information of the food and diet.
The FFQ check list ha two main parts, namely, a list of different food items and the frequency of consumption of these food items. The main advantage is that this method is quick and inexpensive, involving more coverage of the respondents. The data obtained can be analyzed in a very short time as the re ponses are standardized. However, the FFQ method gives only a qualitative description and frequency of the food items consumed. It does not indicate the amounts of food consumed. It also becomes difficult to explain the association between the diet patterns and certain diseases. Sometimes the questionnaire may be long and may need modifications to keep pace with the changing dietary habits.
Food diary
The subject is required to keep a record in written form (diary) and photographs of all the food and beverages consumed over a certain period of time. This method generally utilized when interviewing all the members regarding their dietary intakes. is not possible due to some practical constraints. A time period of one week can be used in the diary to estimate the dietary intake. The subjects arc initially tutored to describe and weigh/estimate the amount food immediately prior to eating and subsequently to record left overs, if any. Standardized bowls and utensils are given to them prior to writing the diary. Even though the subject burden appears to be the highest while using this method, the food diary method has been effectively used in a number of large prospective epidemiological studies and for validating the results obtained from other methods of dietary assessment.
This method consists of dietary records kept just at the time of eating. So there is no question of any kind of “recall”. The method is reliable as sufficient number of days is covered by each subject. The subjects also take interest in filling up the diary. The main disadvantage is that individuals are sometimes not able to estimate the quantity of food consumed accurately. The subject concerned can also be illiterate. Maintaining a diary can also be cumbersome for some individuals. Often, individuals modify their diets so that not much information can be noted in the diary and the records are kept to a minimum. The subject may not be writing the correct dietary information and become biased.
Dietary history
Dietary history records the dietary practices of the respondents over a prolonged period of time. The investigator obtains a retrospective estimate of the food intake using this method. The time duration covered is 3 months to one year. The information is recorded either through interviews and/or questionnaires addressed to the subject. -This method is not used in large scale epidemiological surveys.
The main advantage is that it can be used for individual assessment. This method is now used increasingly by dieticians in the clinical context. Since the time period covered by this method is large, the individuals often cannot remember what they had consumed during the last one year. Moreover, each interview takes a very long time, often up to 90 minutes. The method is also not cost effective.
Sample Questions
- 1) What is meant by nutritional assessment? Discuss its aims.
- 2) What are the prevalent methods currently available for the assessment of nutritional status in man?
- 3) What do you mean by biomarker? Discuss how you can use biomarkers to document nutritional status.
- 4) Briefly discuss the clinical signs and symptoms of malnutrition.