- Indian population structure
A. Race and ethnicity
B. Sir H.H. Risley’s (1915) classification
C. Linguistic classification
D. Classical genetic markers as a criteria for population structure
E. Blood Groups
F. Protein Polymorphism
G. Enzyme Polymorphism
H. Dermatoglyphics
I. Abnormal Haemoglobins
J. Other Genetic Traits
K. DNA as a criteria for population structure
Indian population structure
The Indian population is characterized by a vast assemblage of peoples with different morphology, genetics, culture and language. Thought larger portion of this variability is native, a sizeable fraction of it has been introduced through Large-scale migrations into India in the past. From an evolutionary point of view, it is very important to quantify the biological variation in human populations, to understand the biological affinities and to relate observed patterns of distribution with cultural, linguistic and demographic histories of the Indian populations (Majumder, 1998). Such efforts are intended to shed light on the population structure of India.
A. Race and ethnicity
During the early part of the twentieth century the systems of classification of Indian people were typological and based on anthropometric and somatoscopic characters. The data collected in these early studies provided ample evidence of vast anthropometric and somatoscopic variation among different Indian populations. This typological variations were used to classify the peoples of India into a number of ‘‘racial’’ types. However, now a day the term ‘ethnic group’ is most commonly used and preferred instead of ‘race’. Because, if races are defined as geographically delimited con specific populations characterized by distinciveregional phenotypes, then human races do not exist now and have not existed for centuries (Cartmill, 1999).
Race is a concept. All men living today belongs to a single species i.e. Homosapiens sapiens. But there is variation in different groups or populations, each differing from other. Each of this population constituting the species Homo sapiens were considered as race. According to Hooton, race is a grate division of mankind, the members of which, though individually varying are characterized as a group by certain combinations of morphological and material features, principally, non-adaptive, which have been derived from their common descent.
B. Sir H.H. Risley’s (1915) classification
A number of racial classifications of Indian populations have been reported in the literature. The first attempt for systematic classification of Indian population was made by Sir H.H. Risley in 1915. He classified the Indian population in to seven types.
- The Turko-Iranian Type: Represented by theBaluchis, Brahuis, Afghans and North-Western Frontier Province (characterized by fair skin, wavy to curly hair form with medium brown to black in colour, broad head, tall stature, etc).
- The Indo-Aryan Type: represented by the Rajputs, Khattris and Jats (characterized by fair skin, wavy to curly hair form with brown to black in colour, long head, tall stature, long nose etc.).
The Scytho-Dravidian Type: Represented by the Western India including the Maharashtrian Brahmins and Kunbis (characterized by fair skin, wave to curly hair with dark brown to black in colour, medium to broad head, medium stature an nose, etc.).
The Aryo-Dravidian Type: Represented by the peoples of Uttar Pradesh and some parts of Rajputana, Behar and Sri Lanka (Ceylon) as well as higher caste and lower caste people (characterized by light brown to dark skin coloue, wavy to curly hair with dark brown to black in colour, long head with a tendency towards medium, short to medium stature with medium to broad nose, etc.).
The Mongolo-Dravidian Type: Represented by the people of lower Bengal and Orissa, particularly the Bengali Brahmins and Kayastha and Mohammedans (characterized by darkskin, wavy black hair, broad to medium hair, short to medium stature with medium to broad nose, etc.).
The Mongoloid Type: Represented by the Kannets of Lahul, Kulu, Lepchas, Limbus, Murmis and Gurangs of Nepal and Bodos of Assam and Burmese (characterized by dark with yellowish skin, straight and dark hair, broad head, presence of epicanthic fold, broad face, short to below medium stature, etc.).
The Dravidian Type: Represented by the people from the valley of the Ganges to Sri Lanka (Ceylon) including the whole of Madras, Hyderabad, Central Province and Chota Nagpur (characterized by very dark skin and hair colour, curly hair, long head, short stature with broad nose.
Since Risley’s classification in 1915, a number of scholars were also tried to classify Indian population into different racial groups. They are, Giuffrida-Ruggari in 1921, Haddon in 1924, Roy in 1934 – 1938, v. Eickstedt in 1934, 1952, Guha in 1935, 1937, Sarkar in 1958, Biasutti in 1959, Roginskij and Levin in 1963, Buchi in 1968 and Bowles in 1977, Abe and Tamura in 1983, Mourant in 1983 and Abe in 1985.
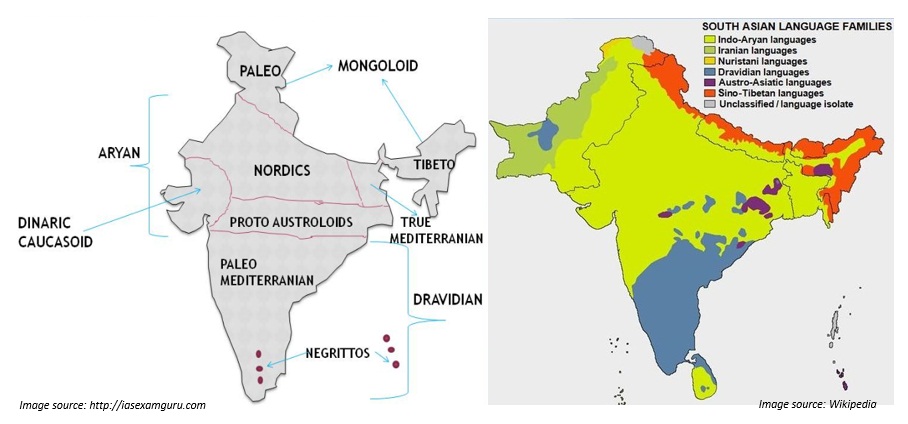
C. Linguistic classification
An attempt has also been made to classify Indian population on the basis of language. The people of India display a high degree of diversity in their languages and dialects. It has been acquired through a long process of peopling of the sub-continent by heterogeneous ethnic groups drawn from the adjacent regions of Asia. According to the 1961 Census of India there were 187 languages spoken by different sections of our society. The languages spoken by the people of India belong to the following four language families (Bhasin 2006):
- The Austro-Asiatic Language Family (Nishada),
- The Tibeto-Chinese Language Family (Kirata),
- The Dravidian Language Family (Dravida), and
- The Indo-European Language Family (Aryan).
D. Classical genetic markers as a criteria for population structure
However, after 1950s with the introduction of blood grouping techniques and, subsequently, electrophoretic techniques for detecting polymorphisms in genetic markers at serum protein and redcell enzyme loci, there was a major chance in the pattern of understanding human variation, which yielded much valuable insight into the biological structure of Indian populations. Surveys conducted next three to four decades were dominated by blood groups and electrophoresis markers along with anthropometry for studying the evolutionary relationships within and between different populations. These studies also revealed marked regional and ethnic differences in the distribution of blood groups and other genetic markers. For example,
E. Blood Groups
| Table 1. Distribution of “A” gene of ABO blood group system Population | % |
| TelangiKumbharand Nandiwala (Maharashtra) | 4.17 |
| Onge tribe (Andaman) | 50.62 |
| Dhodia, Konkani and Worli tribes (Dadra & Nagar Haveli) | 28.96 |
| Kurumba and Yarava (Karnataka) | 30.07 |
| Mala Kuruvan, Mala Vedan, Muthuvan, Paniyan (Ketala) | 25.48 |
| Table 2. Distribution of “B” gene of ABO blood group system Population | % |
| Brahmin, Ezhava, Hurchiar, Nair (Kerala) | 14.73 |
| Oraon (Andaman) | 30.25 |
| Onge (Andaman) | 4.97 |
| Bhotia (U.P.) | 33.18 |
| (Source: Singh et al., 1994) | |
| Table 3. Distribution of “O” gene of ABO blood group system | |
| Population | % |
| Bhotia (U.P.) | 43.26 |
| Nicobarese and Shompen (Andaman and Nicobar) | 90.24 |
| Nandiwala (Maharastra) | >70.00 |
| Pulayan (Kerala) | >60 |
| (Source: Singh et al., 1994) | |
| Table 4. Distribution of “M” gene of MN system | |
| Population | % |
| Dhodia, Konkana and Worli (Dadra and Nagar Haveli) | 42.26 |
| Grate Andamanese, Nicobarese and Onge (Andaman) | 88.49 |
| Manne (Andhra Pradesh) | 88.12 |
| Dogra (Jammu and Kashmir) | 76.42 |
| Riang (Tripura) | 89.00 |
| (Source: Singh et al., 1994) | |
| Table 5. Distribution of “MS Haplotype” of MNSs system | |
| Population | % |
| Chetri, Limboo, Rai, Tamang (Sikkim) | 8.71 |
| Brahmin and Meitie (Manipur) | 7.60 |
| Sikh (West Bengal) | 29.24 |
| Khasi (Meghalaya) | 9.60 |
| Onge (Andaman) | 7.25 |
| Table 6. Distribution of “Ms Haplotype” of MNSs system Population | % |
| Muslims (Orissa) | 64.10 |
| Kota, Toda (Tamil Nadu) | 57.81 |
| Nicobarese (Andaman) | 70.80 |
| Rajbanshi (West Bengal) | 55.02 |
| Bhotia, Lepcha (Sikkim) | 59.27 |
| (Source: Singh et al., 1994) | |
| F. Protein Polymorphism | |
| Table 7. Distribution of “Hp1 gene” of Haptoglobin system | |
| Population | % |
| Santal (West Bengal) | 0.89 |
| Ladakhi (Jammu and Kashmir) | 27.40 |
| Siddi and Jenu-Kurumba (Karnataka) | 22.50 |
| Ezhava (Kerala) | 20.51 |
| (Source: Singh et al., 1994) | |
| Table 8. Distribution of “Gc1” gene of Group specific component system | |
| Population | % |
| Karbi (Assam) | 67.34 |
| Brahmin, Chetri and Pradhan (Sikkim) | 85.51 |
| Madiga (Andhra Pradesh) | 83.10 |
| Langia-Saora (Orissa) | 84.40 |
| Brahmin (Karnataka) | 81.31 |
| (Source: Singh et al., 1994) |
| G. Enzyme Polymorphism | |
| Table 9. Distribution of “G6PD” deficiency | |
| Population | % |
| Naga-Angami (Nagaland) | 27.06 |
| Rajput (Himachal Pradesh) | 14.86 |
| Gond and Oraon (Madhya Pradesh) | 13.28 |
| Santal (West Bengal) | 14.03 |
| Adi, Apatani and Nishi (Arunachal Pradesh) | 16.78 |
| (Source: Singh et al., 1994) | |
| Table 10. Distribution of “PGM1” variants of Phosphoglucomutase system | |
| Population | % |
| Oriya and SaoraLangia (Orissa) | 85.90 |
| Lingayat and Vokkaliga (Karnataka) | 79.81 |
| Bagdi, Kaibarta and Kaora (West Bengal) | 80.26 |
| Bhil and Meena (Rajasthan) | 83.72 |
| Nadar, Reddiar and Thevar (Tamil Nadu) | 76.95 |
| (Source: Singh et al., 1994) | |
| H. Dermatoglyphics | |
| Table 11. Distribution of “finger pattern” | |
| Population Pattern | % |
| Gurung (Uttar Pradesh) Loops | 41.37 |
| Brahmin (Karnataka) Loops | 64.21 |
| Oraon (West Bengal) Whorls | 56.97 |
| Brahmin (Karnataka) Whorls | 32.49 |
| Tibetan (Orissa) Arches | 0.40 |
| Gujjar, Oswal and Rajpur (Rajasthan) Arches | 7.00 |
| (Source: Singh et al., 1994) | |
| Table 12. Distribution of “total ridge count (TRC)” | |
| Population | TRC |
| Gaddi (Himachal Pradesh) | 125.30 |
| SonowalKachari (Assam) | 178.40 |
| Chamar (Uttar Pradesh) | 124.90 |
| Rajbanshi (Assam) | 157.40 |
| (Source: Singh et al., 1994) |
I. Abnormal Haemoglobins
Table 13. Distribution of abnormal haemoglobin traits
| Population | trait | % |
| Panka (Madhya Pradesh) | Sickle cell | 24.28 |
| Kachari (North East region) | Haemoglobin E | 50.59 |
| In West Bengal and Sikkim | Haemoglobin E | <6.00 |
| (Source: Singh et al., 1994) |
J. Other Genetic Traits
| Table 14. Distribution of “non-taster gene (t)” of PTC taste ability Population | % |
| Ladhakhi (Jammu and Kashmir) | 23.79 |
| Adi Karnataka (Karnataka) | 78.17 |
| Nags-Angami (Nagaland) | 24.49 |
| Gond (Madhya Pradesh) | 75.60 |
| (Source: Singh et al., 1994) | |
| Table 15. Distribution of “non-secretor allele” ABH Secretion | |
| Population | % |
| Onge (Andaman) | 14.10 |
| Khond (Orissa) | 78.10 |
| Nair (Kerala) | 66.96 |
| Iyer, Kallan and Mudaliar (Tamil Nadu) | 23.71 |
| (Source: Singh et al., 1994) | |
K. DNA as criteria for population structure
In the last two decades, however, new methods with elaborate statistics and biometry along with the molecular genetic techniques have added new dimension to the study of Indian population structure, which yielded much appreciated understanding into the biological structure of human populations in India. For example, a study by Basu et al., (2003) using 58 DNA markers {mitochondrial (mt), Y- chromosomal, and autosomal} and sequence data of the mtHVS1 from a large number of ethnically diverse populations of India demonstrated that there was an underlying unity of female lineages in India, indicating that the initial number of female settlers may have been small. The tribal and the caste populations were highly differentiated. The result also revealed that Austro-Asiatic tribals were the earliest ettlers in India (as they possess the highest frequencies of the ancient east-Asian mtDNA HG- M and exhibit the highest HVS1 nucleotide diversity. They also have the highest frequency of sub HG M2). It showed that a major wave of humans entered India through the northeast and the Tibeto- Burman tribals shared considerable genetic similarities with the Austro-Asiatic tribals, supporting the hypothesis that they may have shared a common habitat in southern China, but the two groups of tribals can be differentiated on the basis of Y-chromosomal haplotypes. The study also demonstrated that the Dravidian tribals were possibly widespread throughout India before the arrival of the Indo- European-speaking nomads, but retreated to southern India to avoid dominance. Moreover the analysis of DNA markers also demonstrated that the upper castes showed closer genetic affinities with central Asian populations, although those of southern India were more distant than those of northern India.
Another study by Indian Genome Variation Consortium (2008) using data on 405 SNPs observed high levels of genetic divergence between groups of populations that cluster largely on the basis of ethnicity and language. Indian populations not only overlap with the diversity of Hap-Map populations, but also contain population groups that are genetically distinct.
A study by Kashyap et al., (2006) in 54 endogamous Indian populations (representing all major ethnic, linguistic and geographic groups) based on autosomal microsatellite markers detected no evidence of general clustering of population groups based on ethnic, linguistic, geographic or socio-cultural affiliations. However, genetic sub-structuring was observed among populations originating from northeastern and southern India, which was reflective of their migrational histories and genetic isolation, respectively.
However, Indian population experienced several waves of immigrants at different periods of history. These immigrants entered into the ethnic composition of the population at different levels from a very early phase of human civilization. The invasions of these people with several racial elements have left the strains of various developed races together with their ethnic and cultural substratain the land, thus representing the elements of all the main divisions of mankind. Thus, the Indian population is consisting of almost all the primary ethnic strains, including Proto-Australoid (skin colour-dark)